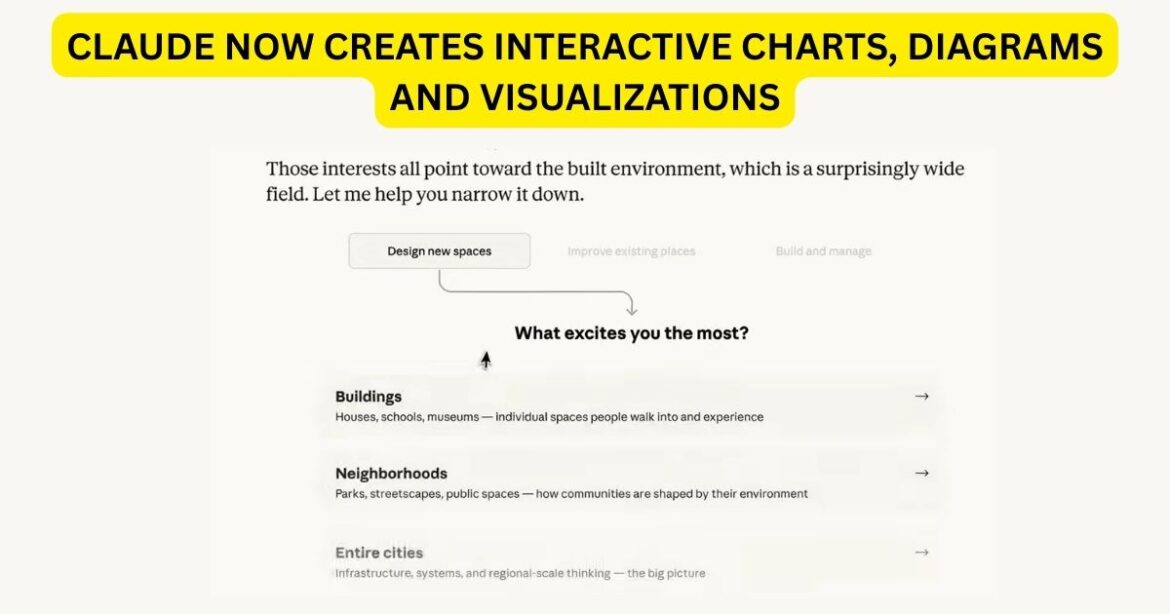
Anthropic’s Claude can now generate interactive charts, diagrams, and visualizations directly inside a conversation — no prompting required, no extra tools, and no subscription needed.
Claude has always been among the most capable AI assistants at reasoning through complex ideas in text. But on Thursday, Anthropic drew a hard line between knowing and showing — rolling out a beta feature that lets Claude build interactive visual aids inline, in real time, as a conversation unfolds.
The update is live today across all plan tiers, including free users, on Claude’s web and desktop apps.
TL;DR
- Claude can now build interactive charts, diagrams, and visualizations directly inside conversations — no extra tools needed.
- Visuals appear inline (not in a side panel) and update as the conversation evolves.
- Available to all users, including free tier, on web and desktop. Mobile not yet supported.
- Built using HTML and SVG — this is not image generation; think whiteboard, not artwork.
- Follows a similar move by OpenAI days earlier, signaling a broader industry shift away from text-only AI responses.
What’s Actually New Here
Claude’s conversations already included Artifacts — permanent tools and documents designed to be shared or downloaded as more polished work. These new visualizations serve a different purpose: Claude builds them to aid understanding as it’s discussing the topic at hand. They appear inline rather than in a side panel, and they’re temporary — changing or disappearing as the conversation evolves.
Think of it as giving Claude a whiteboard mid-lecture, rather than asking it to hand you a finished report.
Anthropic is quick to distinguish this from image generation. When producing visual aids, Claude uses HTML code and XML vector graphics — the company likens it to giving Claude access to its own whiteboard.
Examples highlighted in Anthropic’s announcement include an interactive compound interest curve, a clickable periodic table where each element reveals deeper data, a structural weight-distribution diagram, and a decision tree with dropdown boxes.
How It Works — And How to Trigger It
The feature is enabled by default across all plan types on the web and desktop, with Claude automatically deciding when a visual might help elevate its response. Users can also request one directly with prompts such as “draw this as a diagram” or “visualize how this might change over time.”
Critically, the visualizations are iterative. If the initial chart isn’t quite right, or if you want to see a different angle of the data, users can ask for an adjustment and Claude will update the visualization to reflect new parameters, keeping the flow of the conversation natural and efficient.
Some responses will be interactive — users will be able to click certain portions of charts and graphs, with underlying information surfacing on demand.
Here is the prompt I used to generate the below visualization: “Build a color mixer — let me blend RGB values and see the result”
that’s it. Nothing more. See the magic!
The “Imagine with Claude” Origin Story
This isn’t a feature that appeared from nowhere. Anthropic says the visualization feature is an expansion of “Imagine with Claude,” a temporary experience it briefly showed off in Fall 2025. That preview enabled Claude subscribers to generate custom user interfaces in real time on a virtual desktop — constructing software on the fly rather than writing code. The new visualization feature works similarly, changing and evolving as a conversation develops.
These visualizations and widgets can also interact with apps like Figma, Canva, and Slack, according to Anthropic — a signal that the company is thinking beyond standalone chat and toward a connected productivity layer.
The Competitive Context
The timing is pointed. This release comes just days after OpenAI made ChatGPT capable of generating interactive visuals when explaining science and math concepts. The two companies are converging on a similar insight: text alone is increasingly not enough for AI assistants to be genuinely useful for learning, analysis, or decision-making.
Where OpenAI has leaned aggressively into audio, image, and video generation, Anthropic has historically stayed close to text. Anthropic mostly ignored the multimedia space while Google and OpenAI invested heavily in audio, image, and video models. This update signals a course correction — not into generative media, but into what might be called functional visuals: charts and diagrams built to explain, not to impress.
What This Means for Users and Businesses
Anthropic says the feature reflects a broader shift for Claude. Rather than defaulting to text, the assistant is learning to choose the best format based on the task, the data, and the user’s needs. It follows an upgrade introduced earlier this year that gave Claude purpose-designed formats for certain topics — recipes, for instance, now appear with clearly separated ingredients and steps.
For knowledge workers, the implications are immediate. Someone asking Claude to explain a financial model, a system architecture, or a scientific concept no longer has to mentally translate walls of text into spatial understanding. Claude does that translation now — live, interactively, and iteratively.
For businesses, it lowers the barrier to insight. Product managers can ask for a KPI breakdown and get a chart they can interact with. Engineers can request a system diagram mid-debugging session. Educators can generate explanatory diagrams on the fly.
The Caveats Worth Noting
Anthropic warns it is releasing beta software, so users should expect some quirks along the way. The feature is also not yet available on mobile.
The ephemeral, in-chat nature of the visualizations is also a deliberate design choice — but one that might frustrate power users who want to save or export mid-conversation visuals without converting them to a full Artifact.
Looking Ahead
If the “Imagine with Claude” preview was Anthropic testing whether users wanted visual AI, this rollout is the company’s answer: yes, and here it is for everyone.
The deeper strategic play is clearer when you zoom out. Anthropic is systematically expanding what “a response” from Claude can look like — from plain text, to formatted content, to interactive apps, to inline visualizations. Each layer makes Claude stickier, more useful, and harder to replace with a simpler tool.
The whiteboard is open. The question now is how far Anthropic is willing to take it — and whether interactive charts today become real-time collaborative canvases tomorrow.
Sethuram Kishore is the founder and editor of Worthview, an online publication established in 2008. With over 18 years of experience in SEO, digital marketing, and online publishing, he writes about AI, technology, business, and digital trends. He is also the founder of MoneyHulk, a personal finance and business publication.


One thought on “Claude Just Got a Whiteboard: Anthropic’s AI Can Now Draw Interactive Charts Mid-Conversation”
Comments are closed.