
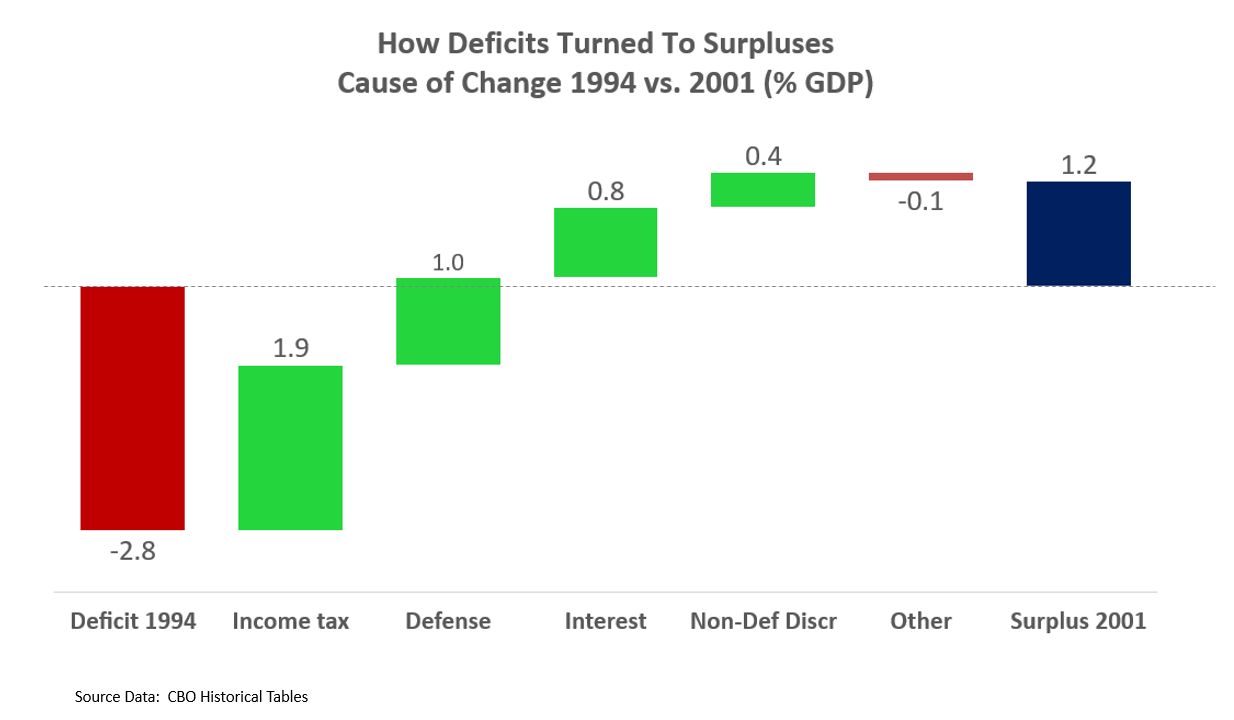
A waterfall chart is a graphical representation of data that flows through stages or tasks. The waterfall chart is so named because the shape of the chart resembles a waterfall. In a waterfall chart, each column represents a value, and the bars in each column represent the cumulative effect of that value. The chart is created by stacking a series of rectangles on top of each other, with each rectangle representing a value in the data set. The height of each rectangle is proportional to the value it means, and the width of each rectangle is proportional to the time it represents. Waterfall charts are beneficial for a variety of reasons. Today, we’ll examine some of the benefits of waterfall charts.
Waterfall charts can highlight where a process has gone off track.
A waterfall chart is a great way to visualize how a process has changed. The chart typically starts with the original value on the left side and then flows to the right, displaying how the value changes over time. This can be a beneficial tool when diagnosing and correcting issues with a process, as it can easily highlight where a process has gone off track. They do so by displaying how each value in the process contributes to the overall outcome.
One of the main advantages of waterfall charts is that they make it easy to see how each step in a process contributes to the overall outcome. This can be helpful when trying to identify and correct any issues with the process.
A waterfall chart shows how a process or project is progressing.
Waterfall charts can show the progress of a process or project. They do so by dividing the whole process or project into a series of steps and then charting the progress of each step. Visualizing the progress of your business processes and projects is helpful because it can help you to better understand how your work is interconnected and identify any areas where improvements could be made. Being able to see the big picture can also make it easier for you to develop a strategic plan for your business.
The waterfall chart can track the cumulative effect of positive or negative values.
A waterfall chart is an excellent tool for tracking the cumulative effect of positive or negative values over time. They do so by creating a series of stacked bars. The value of the bottom bar represents the initial value, and the bars above it represent the accumulative effect of all the values that came before it.
You can easily see how a series of positive or negative values affect the total. This matters because if you want to achieve a specific goal, it is essential to know how fast you need to grow your account to reach that goal. For example, you are considering investing in new stock. If you enter the stock’s value, the length of time you plan to hold it, and the expected rate of return, this calculator will tell you how much you can expect to make on your investment.
Waterfall charts illustrate how a particular change affects the overall financial position of a company.
A waterfall chart is an effective way to illustrate how a particular change in finances affects the overall financial position of a company. They work by plotting data in a series of stacked bars, with the height of each bar representing the total value of that particular data point. This makes it easy to see how each element contributes to the total value and how changes in one aspect will affect the outcome.
Waterfall charts can illustrate anything from the profits and losses of a single quarter to the accumulative effect of several years of financial data. As a result, they can be beneficial for understanding the impact of debt and equity financing on a company’s overall value or illustrating the effects of a single significant transaction on the bottom line. In short, waterfall charts provide a visual way to see the big picture of a company’s financial health.
Take advantage of the benefits of using waterfall charts.
With all of these benefits, it’s easy to see why so many businesses implement this helpful chart. So, consider using a waterfall chart to visualize your company data.
Sethuram Kishore is the founder and editor of Worthview, an online publication established in 2008. With over 18 years of experience in SEO, digital marketing, and online publishing, he writes about AI, technology, business, and digital trends. He is also the founder of MoneyHulk, a personal finance and business publication.